
Hiển thị nhiệt độ CPU, NVMe trên Proxmox Summary Dashboard
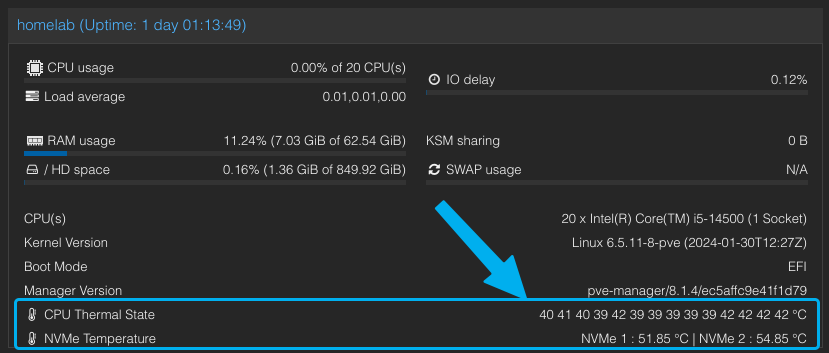
Trong bài viết này, mình sẽ hướng dẫn các bạn làm cách nào để hiển thị được thông tin nhiệt độ CPU và NVMe trên dashboard summary của Proxmox.
Xem nhanh
Bước 1 – Cài package lm-sensors
Đầu tiên, bạn cần SSH vào Proxmox server của bạn, sau đó cài đặt package lm-sensors:
apt-update && apt-get install lm-sensors -yÝ tưởng của chúng ta ở đây sẽ là lấy output của câu lệnh
sensors -jđể sử dụng những thông tin cần thiết và hiển thị trên Dashboard của Proxmox
Ví dụ output của câu lệnh trên đối với hệ thống của mình là
root@homelab:~# sensors -j
{
   "iwlwifi_1-virtual-0":{
      "Adapter": "Virtual device",
      "temp1":{
ERROR: Can't get value of subfeature temp1_input: Can't read

      }
   },
   "nvme-pci-0200":{
      "Adapter": "PCI adapter",
      "Composite":{
         "temp1_input": 54.850,
         "temp1_max": 81.850,
         "temp1_min": -273.150,
         "temp1_crit": 84.850,
         "temp1_alarm": 0.000
      },
      "Sensor 1":{
         "temp2_input": 54.850,
         "temp2_max": 65261.850,
         "temp2_min": -273.150
      },
      "Sensor 2":{
         "temp3_input": 58.850,
         "temp3_max": 65261.850,
         "temp3_min": -273.150
      }
   },
   "acpitz-acpi-0":{
      "Adapter": "ACPI interface",
      "temp1":{
         "temp1_input": 27.800,
         "temp1_crit": 105.000
      }
   },
   "coretemp-isa-0000":{
      "Adapter": "ISA adapter",
      "Package id 0":{
         "temp1_input": 43.000,
         "temp1_max": 80.000,
         "temp1_crit": 100.000,
         "temp1_crit_alarm": 0.000
      },
      "Core 0":{
         "temp2_input": 42.000,
         "temp2_max": 80.000,
         "temp2_crit": 100.000,
         "temp2_crit_alarm": 0.000
      },
      "Core 4":{
         "temp3_input": 43.000,
         "temp3_max": 80.000,
         "temp3_crit": 100.000,
         "temp3_crit_alarm": 0.000
      },
      "Core 8":{
         "temp4_input": 39.000,
         "temp4_max": 80.000,
         "temp4_crit": 100.000,
         "temp4_crit_alarm": 0.000
      },
      "Core 12":{
         "temp5_input": 39.000,
         "temp5_max": 80.000,
         "temp5_crit": 100.000,
         "temp5_crit_alarm": 0.000
      },
      "Core 16":{
         "temp6_input": 39.000,
         "temp6_max": 80.000,
         "temp6_crit": 100.000,
         "temp6_crit_alarm": 0.000
      },
      "Core 20":{
         "temp7_input": 39.000,
         "temp7_max": 80.000,
         "temp7_crit": 100.000,
         "temp7_crit_alarm": 0.000
      },
      "Core 24":{
         "temp8_input": 40.000,
         "temp8_max": 80.000,
         "temp8_crit": 100.000,
         "temp8_crit_alarm": 0.000
      },
      "Core 25":{
         "temp9_input": 40.000,
         "temp9_max": 80.000,
         "temp9_crit": 100.000,
         "temp9_crit_alarm": 0.000
      },
      "Core 26":{
         "temp10_input": 40.000,
         "temp10_max": 80.000,
         "temp10_crit": 100.000,
         "temp10_crit_alarm": 0.000
      },
      "Core 27":{
         "temp11_input": 40.000,
         "temp11_max": 80.000,
         "temp11_crit": 100.000,
         "temp11_crit_alarm": 0.000
      },
      "Core 28":{
         "temp12_input": 42.000,
         "temp12_max": 80.000,
         "temp12_crit": 100.000,
         "temp12_crit_alarm": 0.000
      },
      "Core 29":{
         "temp13_input": 42.000,
         "temp13_max": 80.000,
         "temp13_crit": 100.000,
         "temp13_crit_alarm": 0.000
      },
      "Core 30":{
         "temp14_input": 42.000,
         "temp14_max": 80.000,
         "temp14_crit": 100.000,
         "temp14_crit_alarm": 0.000
      },
      "Core 31":{
         "temp15_input": 42.000,
         "temp15_max": 80.000,
         "temp15_crit": 100.000,
         "temp15_crit_alarm": 0.000
      }
   },
   "nvme-pci-0100":{
      "Adapter": "PCI adapter",
      "Composite":{
         "temp1_input": 51.850,
         "temp1_max": 81.850,
         "temp1_min": -273.150,
         "temp1_crit": 84.850,
         "temp1_alarm": 0.000
      },
      "Sensor 1":{
         "temp2_input": 51.850,
         "temp2_max": 65261.850,
         "temp2_min": -273.150
      },
      "Sensor 2":{
         "temp3_input": 55.850,
         "temp3_max": 65261.850,
         "temp3_min": -273.150
      }
   }
}
Bước 2 – Trích xuất thông tin
Sau khi SSH được vào trong Proxmox server của bạn rồi, thì chúng ta cần chỉnh sửa file ở đường dẫn:
/usr/share/perl5/PVE/API2/Nodes.pmTốt nhất, trước khi chỉnh sửa file này, bạn hãy tạo 1 bản backup và tiếp tục tìm dòng chứa đoạn code sau:
$dinfo = df('/', 1);Phía trên dòng này, bạn thêm:
$res->{thermalstate} = `sensors -j`;như hình sau đây:
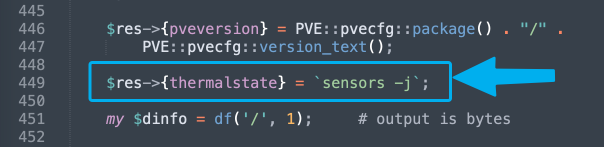
Output của lệnh sensors -j sẽ được lưu vào biến thermalstate mà chúng ta có thể dùng để trích xuất thông tin ở bước tiếp theo
Bước 3 – Thể hiện thông tin trên Proxmox Dashboard
Ở bước này, chúng ta sẽ cần phải chỉnh sửa file tại đường dẫn sau đây:
/usr/share/pve-manager/js/pvemanagerlib.jsTất nhiên, hãy backup trước khi sửa file để đỡ mất thời gian cài lại từ đầu.
Bạn sẽ cần tìm cụm code sau đây:
pveversionSau đó, bạn cần thêm đoạn code như hình vẽ. Bạn hãy nhìn hình, code mình để phía dưới.
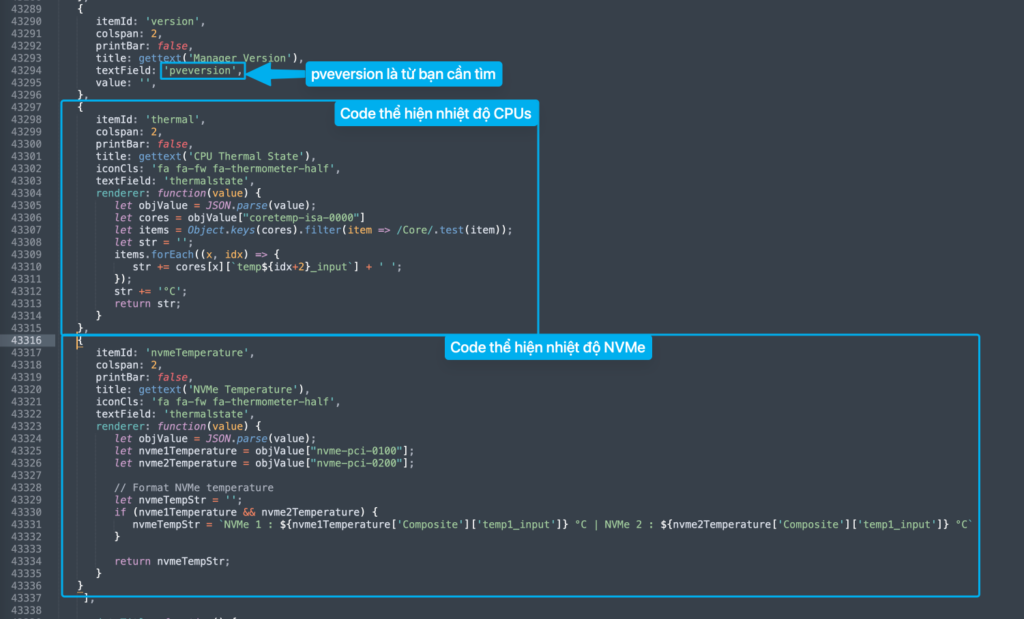
Đoạn code thể hiện nhiệt độ của CPUs:
{
   itemId: 'thermal',
   colspan: 2,
   printBar: false,
   title: gettext('CPU Thermal State'),
   iconCls: 'fa fa-fw fa-thermometer-half',
   textField: 'thermalstate',
   renderer: function(value) {
      let objValue = JSON.parse(value);
      let cores = objValue["coretemp-isa-0000"]
      let items = Object.keys(cores).filter(item => /Core/.test(item));
      let str = '';
      items.forEach((x, idx) => {
         str += cores[x][`temp${idx+2}_input`] + ' ';
      });
      str += '°C';
      return str;
   }
}
Đoạn code này sẽ cần phải chỉnh sửa dựa trên output của câu lệnh sensors -j , vì nhiệt độ CPUs của mình được lưu trong key "coretemp-isa-0000"
Đoạn code thể hiện nhiệt độ của NVMe
Vì mình có 2 ổ NVMe, nên mình sẽ có tương ứng: "nvme-pci-0100" và "nvme-pci-0200", hãy xem output của sensors -j để tuỳ biến cho đúng theo hệ thống của bạn.
{
   itemId: 'nvmeTemperature',
   colspan: 2,
   printBar: false,
   title: gettext('NVMe Temperature'),
   iconCls: 'fa fa-fw fa-thermometer-half',
   textField: 'thermalstate',
   renderer: function(value) {
      let objValue = JSON.parse(value);
      let nvme1Temperature = objValue["nvme-pci-0100"];
      let nvme2Temperature = objValue["nvme-pci-0200"];

      // Format NVMe temperature
      let nvmeTempStr = '';
      if (nvme1Temperature && nvme2Temperature) {
         nvmeTempStr = `NVMe 1 : ${nvme1Temperature['Composite']['temp1_input']} °C | NVMe 2 : ${nvme2Temperature['Composite']['temp1_input']} °C`
      }

      return nvmeTempStr;
   }
}
Phần icon hình cái nhiệt kế được thiết lập dựa trên key iconCls vì mình xem code Dashboard của Proxmox thì thấy rằng nó dùng bộ font awesome, nếu bạn thích thay icon khác thì có thể thay giá trị của key này.
Bước 4 – Khởi động lại
Sau khi thực hiện xong các thay đổi trên, chúng ta restart lại pveproxy, xoá cache trình duyệt và tận hưởng kết quả
systemctl restart pveproxyCảm ơn các bạn đã theo dõi bài viết, chúc thành công.
